Overview
Personalize drug regimens using individual pharmacokinetic (PK) and pharmacokinetic-pharmacodynamic (PK-PD) profiles. By combining therapeutic drug monitoring (TDM) data with a population model, posologyr offers accurate posterior estimates and helps compute optimal individualized dosing regimens.
Key dosage optimization functions in posologyr include:
-
poso_dose_conc()estimates the optimal dose to achieve a target concentration at any given time -
poso_dose_auc()estimates the dose needed to reach a target area under the concentration-time curve (AUC) -
poso_time_cmin()estimates the time required to reach a target trough concentration (Cmin) -
poso_inter_cmin()estimates the optimal dosing interval to consistently achieve a target Cmin
Individual PK profiles can be estimated with or without TDM data:
-
poso_estim_map()computes Maximum A Posteriori Bayesian Estimates (MAP-BE) of individual PK parameters using TDM results -
poso_simu_pop()samples from the the prior distributions of PK parameters
posologyr leverages the simulation capabilities of the rxode2 package.
Installation
You can install the released version of posologyr from CRAN with:
install.packages("posologyr")You can install the development version of posologyr from GitHub with:
# install.packages("remotes")
remotes::install_github("levenc/posologyr")
Bayesian dosing example
To determine the optimal dose of gentamicin for a patient with posologyr, you will need:
- A prior PK model, written in
rxode2mini-language
In this example, a gentamicin PK from the literature doi:10.1016/j.ijantimicag.2003.07.010
mod_gentamicin_Xuan2003 <- function() {
  ini({
    THETA_Cl  = 0.047
    THETA_V   = 0.28
    THETA_k12 = 0.092
    THETA_k21 = 0.071
    ETA_Cl  ~ 0.084
    ETA_V   ~ 0.003
    ETA_k12 ~ 0.398
    ETA_k21 ~ 0.342
    add_sd  <- 0.230
    prop_sd <- 0.237
  })
  model({
    TVl   = THETA_Cl*ClCr
    TVV   = THETA_V*WT
    TVk12 = THETA_k12
    TVk21 = THETA_k21

    Cl    = TVl*exp(ETA_Cl)
    V     = TVV*exp(ETA_V)
    k12   = TVk12*exp(ETA_k12)
    k21   = TVk21 *exp(ETA_k21)

    ke    = Cl/V
    Cp    = centr/V

    d/dt(centr)  = - ke*centr - k12*centr + k21*periph
    d/dt(periph) =            + k12*centr - k21*periph

    Cp ~ add(add_sd) + prop(prop_sd) + combined1()
  })
}- A table of the patient’s TDM data, in a format similar to the data for NONMEM
patient_data <- data.frame(ID=1,
                           TIME=c(0.0,1.0,11.0),
                           DV=c(NA,9,2),
                           AMT=c(180,0,0),
                           DUR=c(0.5,NA,NA),
                           EVID=c(1,0,0),
                           ClCr=38,
                           WT=63)
patient_data
#>   ID TIME DV AMT DUR EVID ClCr WT
#> 1  1    0 NA 180 0.5    1   38 63
#> 2  1    1  9   0  NA    0   38 63
#> 3  1   11  2   0  NA    0   38 63
Individual PK profile
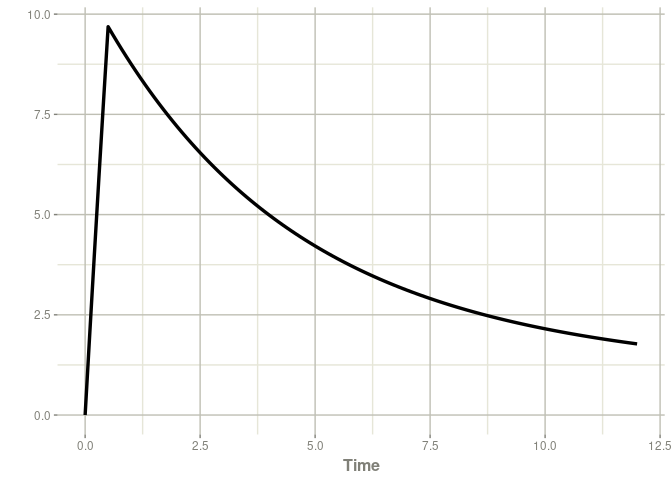
With these two elements, you can estimate and plot and the individual concentrations over time.
patient_map <- poso_estim_map(patient_data,mod_gentamicin_Xuan2003)
plot(patient_map$model,Cc)
Dose optimization
We will optimize the gentamicin dosage for this patient to meet two criteria:
- A peak concentration of 12 mg/L, 30 minutes after a 30-minute infusion.
- A trough concentration of less than 0.5 mg/L.
The time required to reach a residual concentration of 0.5 mg/L can be estimated as follows:
poso_time_cmin(patient_data,mod_gentamicin_Xuan2003,tdm=TRUE,
               target_cmin = 0.5)
#> $time
#> [1] 44.9
#>
#> $type_of_estimate
#> [1] "point estimate"
#>
#> $cmin_estimate
#> [1] 0.4991313
#>
#> $indiv_param
#>   THETA_Cl THETA_V THETA_k12 THETA_k21 add_sd prop_sd     ETA_Cl       ETA_V
#> 3    0.047    0.28     0.092     0.071   0.23   0.237 0.03701064 0.001447308
#>      ETA_k12     ETA_k21 ClCr WT
#> 3 0.08904703 -0.04838898   38 63
The dose required to achieve our target concentration can then be determined for an infusion at H48.
poso_dose_conc(patient_data,mod_gentamicin_Xuan2003,tdm=TRUE,
               target_conc = 12,duration=0.5,time_dose = 48,time_c = 49)
#> $dose
#> [1] 237.5902
#>
#> $type_of_estimate
#> [1] "point estimate"
#>
#> $conc_estimate
#> [1] 12
#>
#> $indiv_param
#>   THETA_Cl THETA_V THETA_k12 THETA_k21 add_sd prop_sd     ETA_Cl       ETA_V
#> 3    0.047    0.28     0.092     0.071   0.23   0.237 0.03701052 0.001447305
#>      ETA_k12     ETA_k21 ClCr WT
#> 3 0.08904752 -0.04838936   38 63
In conclusion a dose of 240 mg 48 h after the first injection would be appropriate to meet our 2 criteria.
More examples can be found at: https://levenc.github.io/posologyr/
Performance of the MAP-BE algorithm in posologyr
posologyr showed comparable performance to NONMEM MAP estimation with option MAXEVAL=0:
- Pharmaceutics 2022, 14(2), 442; doi:10.3390/pharmaceutics14020442
- Supporting data: https://github.com/levenc/posologyr-pharmaceutics
